

Is Funding Rate Arbitrage Profitable? We Tested 12 Months of Scanner Gaps on 40 Coins
Short answer: funding rate arbitrage rarely pays what a scanner shows. In this trade you short a coin on the exchange with the higher funding rate and buy it where the rate is lower. We tested 12 months of data for 40 coins. Big gaps between Binance, Bybit and Hyperliquid usually closed within two or three hours. A one-day trade collected about a third of the rate on the screen, and most such trades lost money after taker fees.
What we measured, from 2 November 2025 to 13 November 2026:
- The largest funding gap between the three exchanges was under 10% a year in half of all hours, and 50% a year or more in about 3% of hours. On BTC it reached 50% in 0.02% of hours.
- A gap above 50% a year lasted a median of 2 hours. 95% of such gaps closed within 8 hours.
- Held for a day, a trade collected 26–32% of the funding the screen promised. Held for a week, 9–18%.
- Week-long trades opened when the gap was 100% a year or more did best: 67% ended positive after taker fees, with a median result of +0.13% of the position. That is before slippage, transfers and the risk of losing one leg.
What is funding rate arbitrage?
Funding rate arbitrage is a trade that tries to collect funding payments while price moves cancel out. Funding is a regular payment between holders of a perpetual futures contract: when the rate is positive, longs pay shorts; when it is negative, shorts pay longs. Our guide to the funding rate explains the formula and who pays whom.
There are two common versions:
- Spot and perpetual (cash and carry). Buy the coin on spot and short the same amount on a perpetual. While funding is positive, the short receives it.
- Cross-exchange. Short the perpetual on the exchange with the higher funding rate and go long the same coin where the rate is lower. You earn the difference between the two rates.
This article tests the cross-exchange version, because that is what funding arbitrage scanners list: coins ranked by the gap in funding between exchanges.
How does a funding arbitrage scanner calculate APR?
A scanner turns each exchange's funding rate into a yearly figure and shows the difference. The formula is the rate of one payment × the number of payments in a year. A rate of 0.01% every 8 hours is 0.01% × 3 × 365 = 10.95% a year.
Exchanges pay at different intervals. Hyperliquid pays every hour (Hyperliquid docs). In our snapshot of the Binance API on 23 October 2026, 80% of its USDT perpetuals paid every 4 hours and the rest mostly every 8. Binance and Bybit also switch a coin to hourly payments after a payment hits the rate cap, and OKX shortens the interval step by step, from 8 hours to 4, 2 and 1 (Binance, Bybit, OKX).
The APR column hides three things:
- It assumes the rate stays put for a year. In our data, a big gap lasted a median of 2 hours.
- It is built from one payment. On Hyperliquid, one hourly rate is multiplied by 8,760 hours, so one unusual hour turns into a large APR.
- The interval can change in the middle of a trade. INIT on Binance paid 6 times on 9 November 2026, 12 times on 10 November and 24 times on 11 November.
Check the arithmetic too. An hourly rate of 0.05% is 0.05% × 24 × 365 = 438% a year. One 2026 guide we read gave 43.8%, ten times too low.
How often do scanners show a big funding gap?
Rarely, and almost never on Bitcoin or Ether. We checked 354,140 coin-hours across 40 coins. In 50.1% of them, the largest gap between Binance, Bybit and Hyperliquid was under 10% a year. The gap was 20% a year or more in 21.3% of hours, 50% or more in 3.25% and 100% or more in 0.7%.
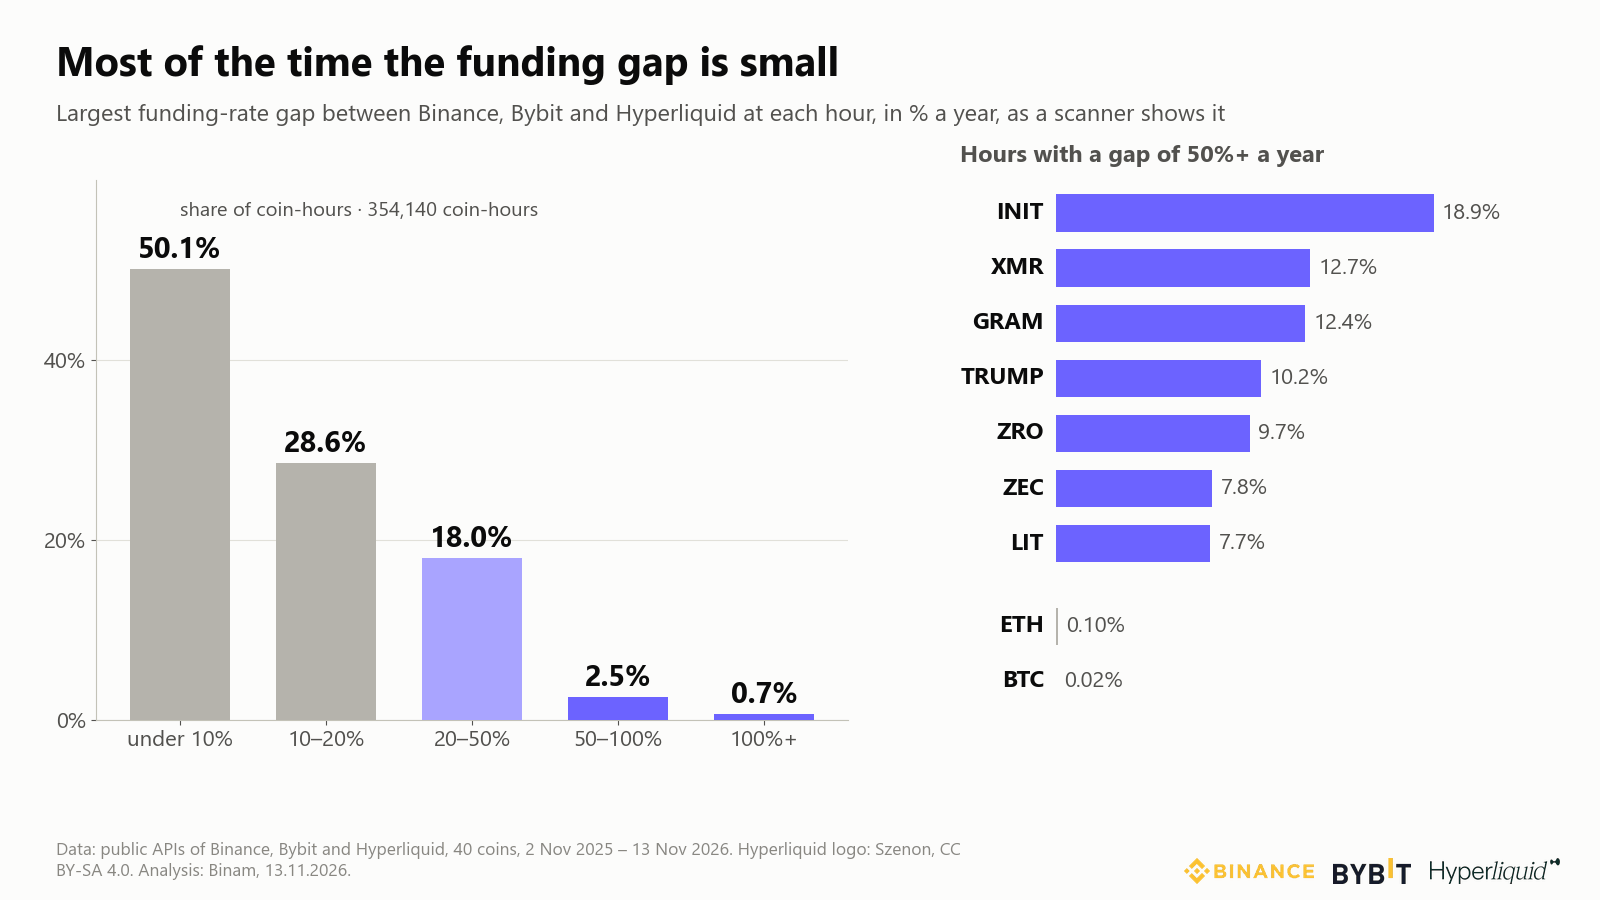
- Big gaps sit on smaller coins. INIT had a gap of 50% a year or more in 18.9% of hours, XMR in 12.7%, GRAM in 12.4% and TRUMP in 10.2%. ETH had one in 0.10% of hours and BTC in 0.02%.
- Hyperliquid is usually one side of the gap. It was involved in 88% of hours with a gap of 50% a year or more. Its hourly rate follows the price premium of the last hour, so it swings more than the 4- and 8-hour rates of Binance and Bybit.
- Scanners that cover more venues show bigger numbers. A 2026 study of 26 exchanges and 812 coins found larger gaps than ours, mostly because it includes many small coins and small exchanges (MDPI, 2026).
How long does a funding rate gap last?
Usually a few hours. When the gap rose above 50% a year, it stayed there for a median of 2 hours, and 95% of these 3,905 episodes ended within 8 hours. 45% lasted a single hour. Gaps above 20% a year lasted a median of 3 hours, and 90% were gone within 8 hours.
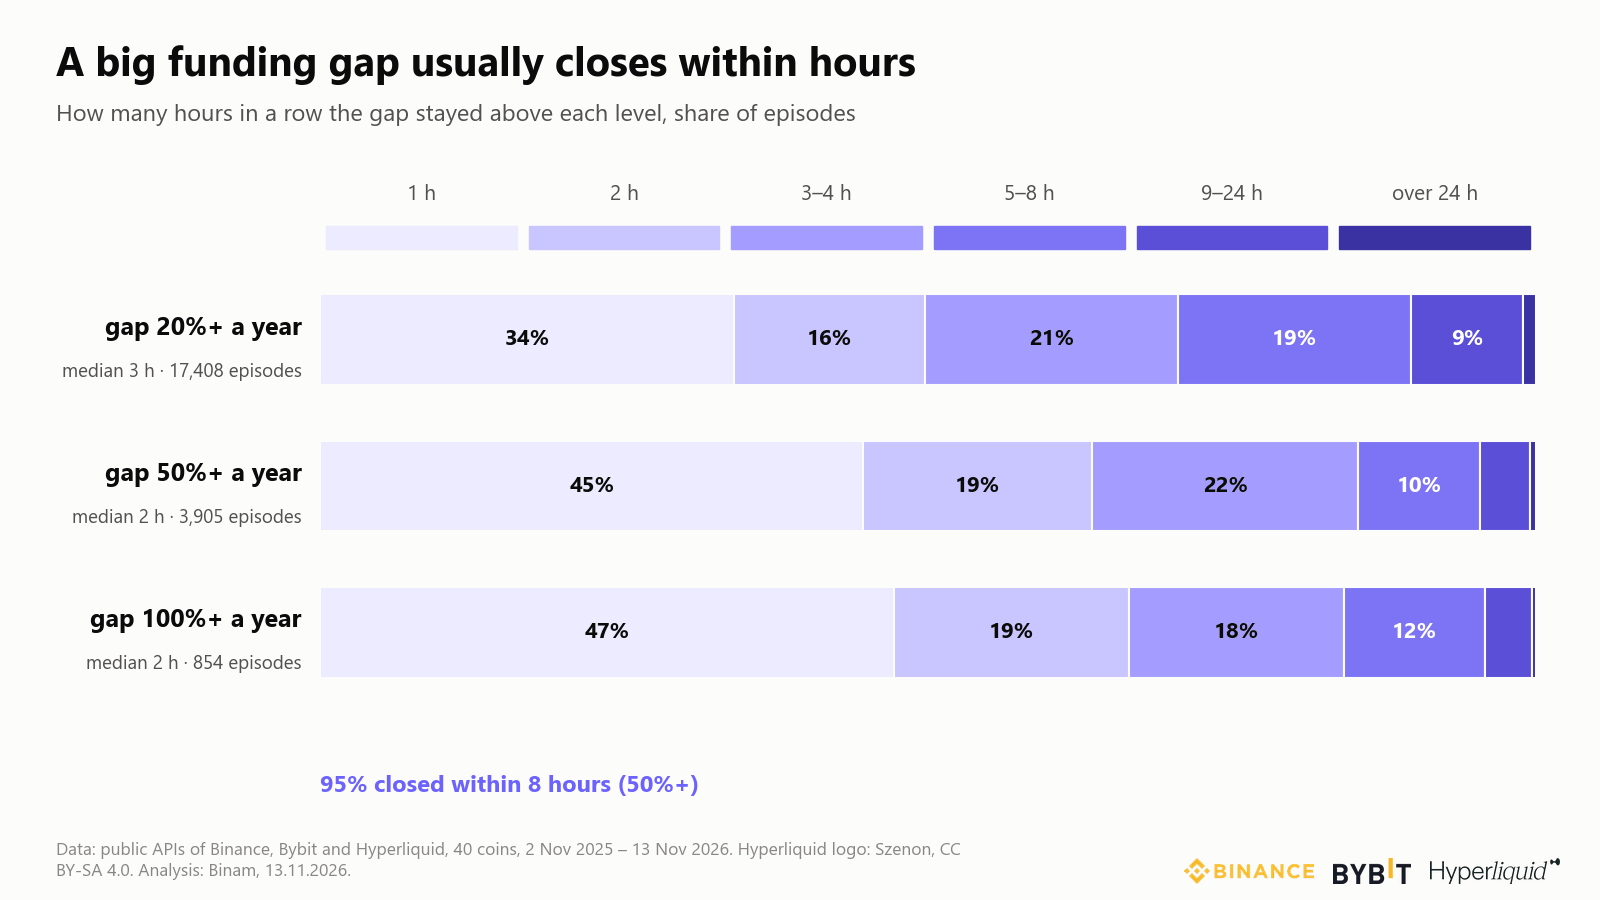
The timing matters because most exchanges pay every 4 or 8 hours. If you open the trade after you see a gap, there is a good chance it is gone before the next payment on the leg that pays every 8 hours.
How much of the APR on the screen do you actually collect?
About a third over one day, and a tenth to a fifth over a week. We opened a test trade every 8 hours whenever a coin's gap was 20% a year or more. The trade was a short on the exchange with the higher rate and a long of the same size on the exchange with the lower rate. We then added up the funding actually paid on both legs.
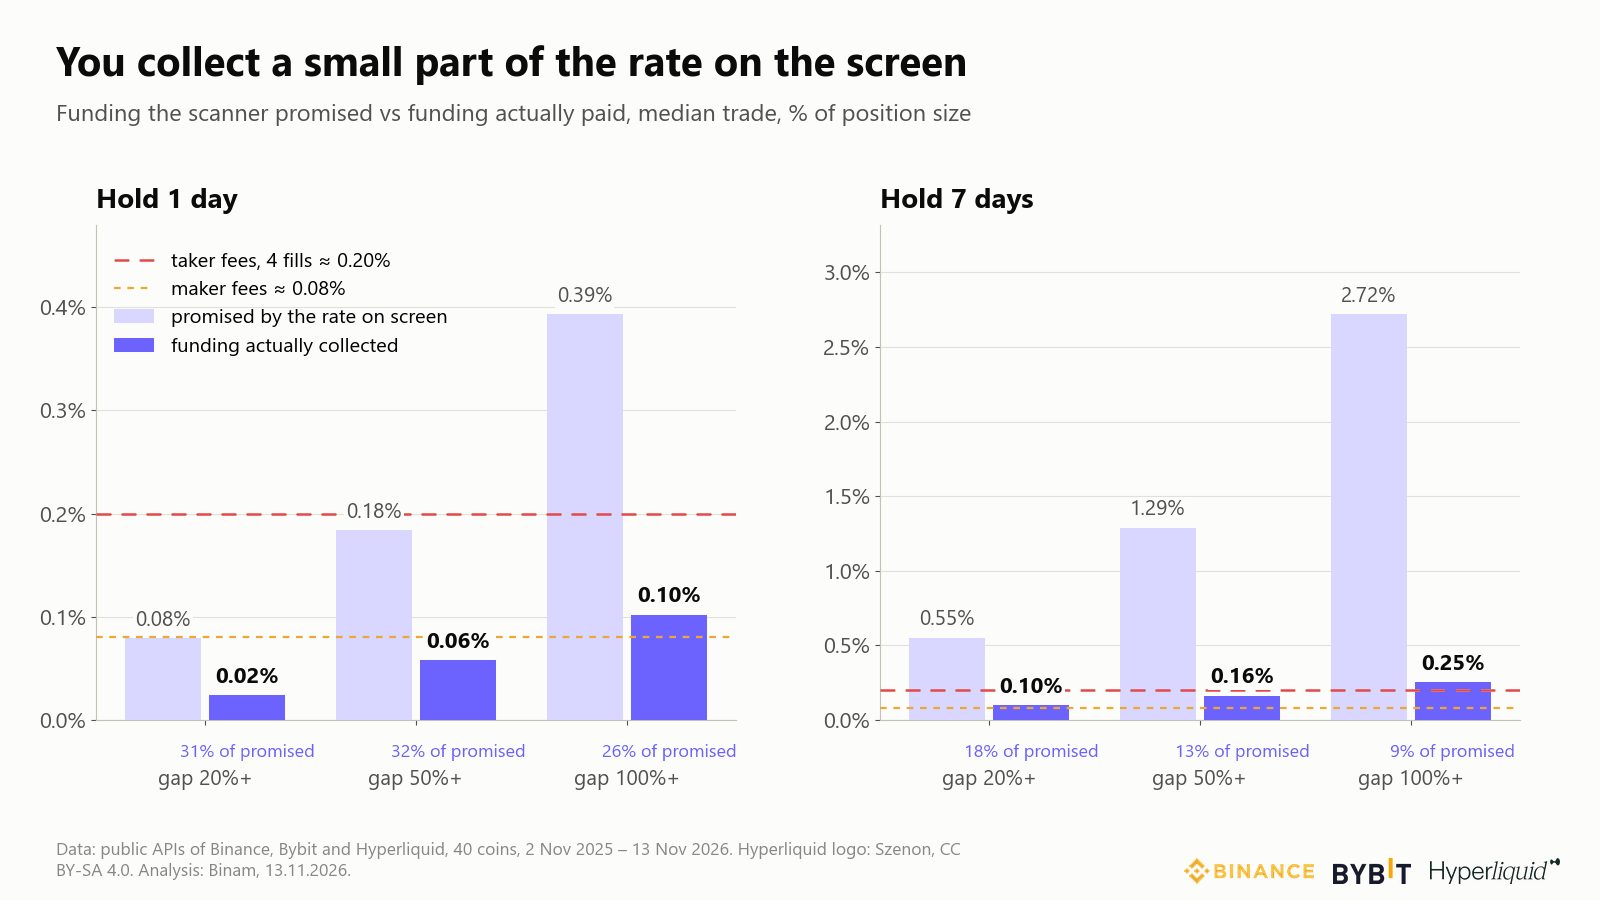
Take a gap of 50% a year held for one day. The rate on the screen promised 0.18% of the position. The funding actually paid was 0.06%, or 32% of that. Held for a week, the promise grew to 1.29% and the payout to 0.16%, or 13%. Rates drift back to normal soon after a spike, and sometimes the gap flips sign.
The payout has to cover fees. At the base fee level, a futures fill costs 0.05% on Binance, 0.055% on Bybit and 0.045% on Hyperliquid with a market order, and 0.02%, 0.02% and 0.015% with a limit order (Binance, Bybit, Hyperliquid). A cross-exchange trade has four fills: open and close on two exchanges. That costs 0.19–0.21% of the position with market orders and 0.07–0.08% with limit orders. Over one day, the median trade never collected enough funding to cover taker fees, at any entry level we tested.
Is funding rate arbitrage profitable after fees?
For trades of a day or less, mostly not. For week-long trades after very large gaps, more often than not, with small margins. The result below is funding plus the change in the price gap between the two exchanges, minus fees.
Share of trades that ended positive, with taker fees / maker fees:
| Gap at entry | Exit when the gap closes | Hold 1 day | Hold 7 days |
|---|---|---|---|
| 20% a year or more | 5% / 26% | 6% / 33% | 30% / 61% |
| 50% a year or more | 16% / 46% | 20% / 59% | 53% / 75% |
| 100% a year or more | 30% / 61% | 38% / 72% | 67% / 81% |
Median result with taker fees, % of position size:
| Gap at entry | Exit when the gap closes | Hold 1 day | Hold 7 days |
|---|---|---|---|
| 20% a year or more | −0.18% | −0.16% | −0.09% |
| 50% a year or more | −0.13% | −0.10% | +0.02% |
| 100% a year or more | −0.09% | −0.03% | +0.13% |
What stands out:
- Closing as soon as the gap closes did worst. The median trade lasted 7–8 hours and paid four fees for one or two funding payments.
- Week-long trades did better partly because of price, not funding. The exchange with the higher funding rate usually traded a little higher too, and that price gap tended to narrow, which helps the short. An academic paper on perpetual futures reached the same conclusion: price convergence mattered more than funding (He et al., 2026 version). In the worst 10% of week-long trades after a 100%+ gap, the price gap cost 0.16% of the position or more.
- Results are per position, not per dollar of your money. With 1x leverage on each leg you need margin equal to the position on both exchanges, so +0.13% of the position is about +0.07% of your money for a week.
- BTC and ETH gave almost no trades. There were 13 one-day entries in a year, and none ended positive after taker fees.
- Our test is generous. It leaves out slippage, moving money between exchanges and the chance of losing one leg to liquidation.
What happens when the gap is huge? INIT in November 2026
The biggest gaps appear when a coin is being squeezed, and that is also when prices on different exchanges drift apart. INIT, from 9 to 12 November 2026, is a fresh example.
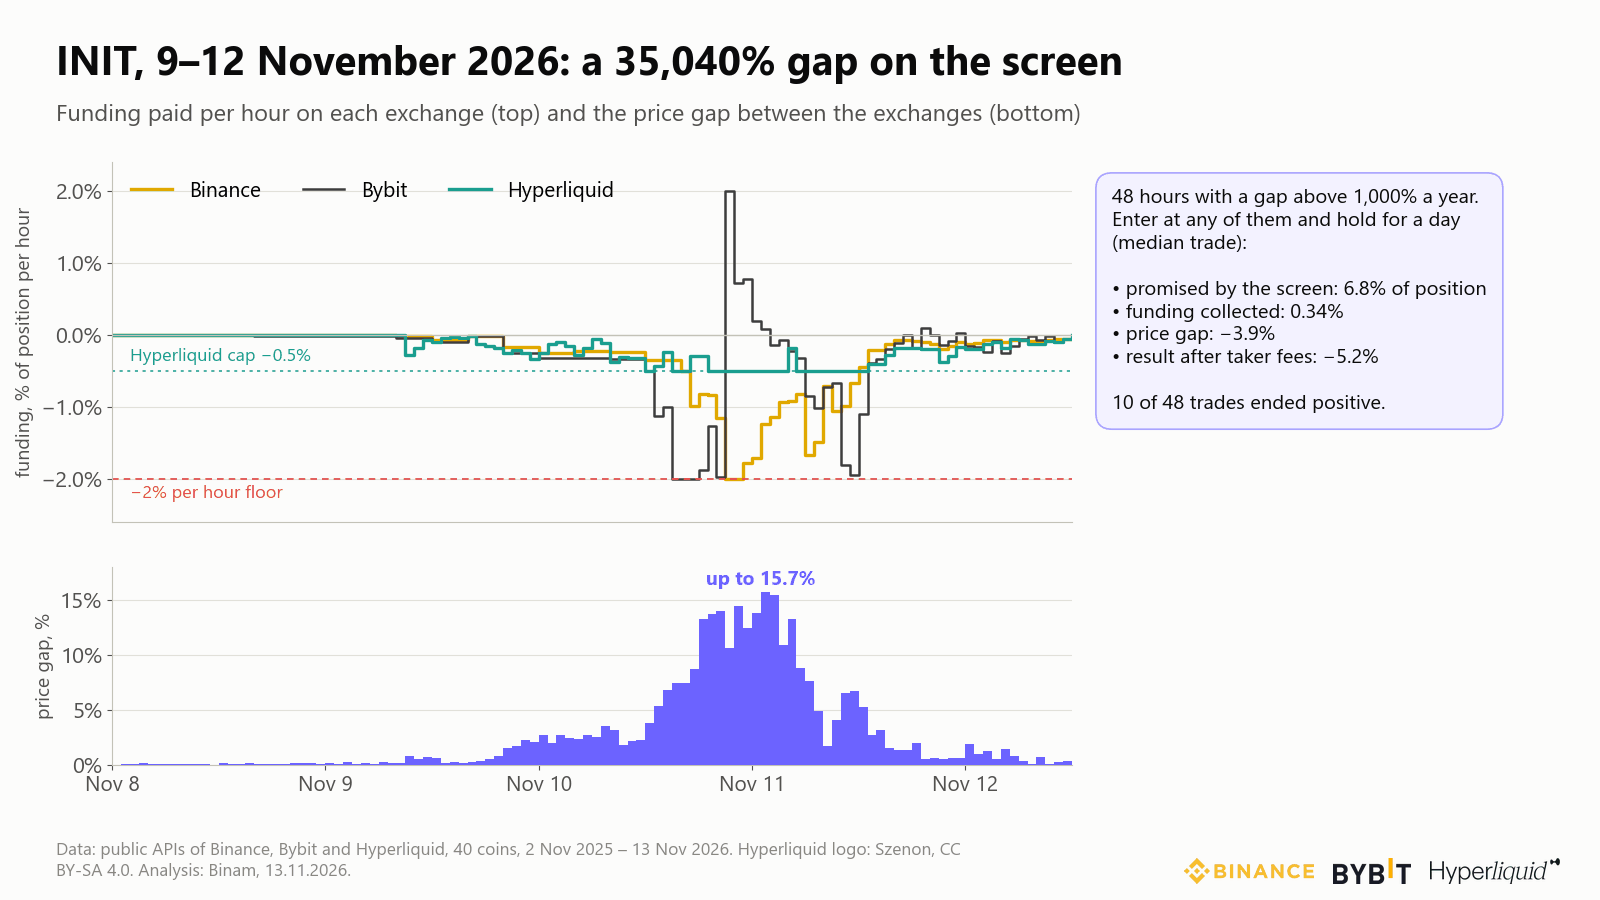
- Funding hit the limits. On Binance and Bybit, INIT funding reached the −2% floor, paid every hour. Shorts on Binance paid 15.8% of their position value on 10 November alone. Hyperliquid stopped at its cap of −0.5% per hour, which is the same for every coin (Hyperliquid docs).
- The sign flipped within an hour. At 21:00 UTC on 10 November, Bybit's rate went from −1.97% to +2% while Binance stayed at −2%. A scanner would have shown a gap of 35,040% a year.
- Price moved more than funding. INIT traded at about $0.12 on Binance on 8 November, reached $0.29 on 10 and 11 November and fell to $0.11 on 12 November. At hourly closes, the price on one exchange was up to 15.7% away from another.
- The trade lost money. In 48 hours between 9 and 12 November the gap was above 1,000% a year. Entered at any of those hours and held for a day, the median trade was promised 6.8% of the position, collected 0.34% in funding and lost 3.9% on the price gap. The median result after taker fees was −5.2%, and 10 of the 48 trades ended positive.
The price itself more than doubled in two days. A short opened before the move with 2x leverage would have been liquidated. Its matching long on another exchange would have kept going, unhedged.
What are the risks of funding rate arbitrage?
The trade is hedged only while both legs stay open. The main risks:
- Losing one leg. Margin sits on two exchanges and cannot move between them instantly. If the price runs against one leg, it can be liquidated while the other leg's profit is stuck on the other exchange. Binance notes that funding is taken from the position margin when the balance runs short, which moves the liquidation price closer (Binance).
- Auto-deleveraging (ADL). On 10 October 2025, about $20 billion of futures positions were liquidated. Exchanges used ADL, which closed profitable shorts that market makers held against spot and left them holding the coins unhedged (CoinMarketCap on BitMEX's report). Binance ranks positions for ADL by profit percentage × leverage, so a winning leg with high leverage goes first (Binance ADL FAQ).
- Different rules on each leg. The same coin can pay every hour on one exchange and every 4 or 8 hours on another, with a different cap. During the INIT squeeze, the floor was −2% per hour on Binance and Bybit and −0.5% on Hyperliquid.
- The payer can fail. Bitget warns that if the paying side is liquidated, the receiving side may get less than the full funding (Bitget).
- Exchange risk. Your money sits on two exchanges at once. Our article on how fast an exchange can leave a market shows how little notice traders sometimes get.
What do popular funding arbitrage guides get wrong?
We read the guides that rank for funding rate arbitrage. Four mistakes came up more than once:
- "Funding is paid every 8 hours." Most Binance USDT perpetuals pay every 4 hours, Hyperliquid pays every hour, and intervals change after a payment hits the cap.
- Wrong annualizing. 0.05% per hour is 438% a year, not 43.8%.
- Treating the round-trip fee as a daily cost. The fee is paid once. The funding collected over the whole holding period has to beat it. One example used a 0.04% round trip. At base fee levels a round trip costs 0.19–0.21% with market orders for the cross-exchange version, and more for spot and perpetual.
- "Low risk or even no risk." The INIT squeeze and the ADL on 10 October 2025 show how a hedged trade can lose one of its legs.
Can you do funding arbitrage on a prop firm account?
Not at Binam. Funding is not charged on Binam challenge accounts, so there is no funding to collect there, and positions you hold for several days during a challenge do not pay it either. Binam is a crypto prop trading firm: traders pass a One-Step or Two-Step evaluation and then trade with the firm's capital. Rules differ between firms, so check how another firm handles funding before you hold a position through a funding time.
Where can you see funding rates on several exchanges?
Binam's free crypto screener shows current funding rates for Binance, Bybit and OKX side by side, with a countdown to the next payment and no sign-up. It shows the rate right now. This article shows what usually happened next.
Before acting on a gap, check four things:
- The interval on each leg. A 1-hour and an 8-hour rate are not comparable until you convert both to the same period.
- How long the gap has been there. In our data, most gaps above 50% a year were gone within 2 hours.
- Fees against the realistic payout. At 0.20% for four taker fills, a one-day trade needs the funding actually paid, not the rate on screen, to beat that number.
- The price gap between exchanges. On small coins in a squeeze it moved by several percent within hours, far more than a day of funding.
Fees are the biggest cost in this trade. Binam's fee cashback returns up to 40% of trading fees on Bybit, OKX and BingX.
Frequently asked questions
Is funding rate arbitrage risk-free?
No. The two legs cancel price moves only while both stay open. In our 12-month test, most one-day trades lost money after taker fees. During the INIT squeeze in November 2026, the price gap between exchanges reached 15.7% and cost the median trade 3.9%. On 10 October 2025, auto-deleveraging closed hedging shorts and left traders holding unhedged coins.
How much can you make with funding rate arbitrage?
In our test, the median one-day trade lost 0.03–0.16% of the position after taker fees, depending on the gap at entry. The best case was a week-long trade opened at a gap of 100% a year or more: a median of +0.13% of the position, positive in 67% of trades. That is before slippage and transfers, and such entries came up 139 times in a year across 40 coins.
What funding rate gap is worth trading?
A gap only helps if the funding actually paid beats about 0.20% in taker fees, or about 0.08% with limit orders. A one-day trade would need a gap of about 73% a year that holds all day to cover 0.20%. In our data, even gaps above 100% a year did not cover taker fees in one day for the median trade, because they shrank quickly.
Which exchanges have the biggest funding gaps?
In our data, Hyperliquid was on one side of 88% of hours with a gap of 50% a year or more, mostly against Binance or Bybit. Hyperliquid pays every hour, so its rate swings more. Gaps were largest on smaller coins such as INIT, XMR, GRAM and TRUMP, and almost absent on BTC and ETH.
Does Hyperliquid pay funding every hour?
Yes. Hyperliquid pays funding every hour at one eighth of the computed 8-hour rate, and the payment is based on the oracle price rather than the mark price (Hyperliquid docs). During the INIT squeeze in November 2026, its rate stopped at −0.5% per hour while Binance and Bybit went to −2%.
How do I convert a funding rate to APR?
Multiply the rate of one payment by the number of payments in a year. For 8-hour funding that is 3 × 365 = 1,095 payments, so 0.01% becomes 10.95% a year. For 4-hour funding it is 2,190 payments, and for hourly funding 8,760. Compare exchanges only after converting both rates the same way.
Is funding charged on a Binam challenge account?
No. Binam does not charge funding on challenge accounts, so a cross-exchange funding trade has nothing to collect there. Funding also does not reduce positions you hold for several days during the challenge. Check the rules of other firms before holding a position through a funding time.
How we tested
- Data: funding history and 1-hour candles from the public APIs of Binance, Bybit and Hyperliquid, 2 November 2025 to 13 November 2026. We also downloaded OKX and Bitget, but their APIs gave a shorter history, so they are not in the trade tests.
- Coins: the 40 largest USDT perpetuals on Binance by 24-hour volume on 13 November 2026 that also trade on Bybit and Hyperliquid.
- Scanner rate: each hour, the last funding rate paid on each exchange, divided by its interval and multiplied by 8,760 hours. Scanners show the predicted next rate, which is usually close to the last one.
- Test trade: every 8 hours per coin when the gap was at least 20% a year; short on the higher rate, long on the lower, equal size. Funding is the actual payments on both legs; the price gap is measured at hourly closes; fees are base-level, four fills. "Exit when the gap closes" means the gap between the same two exchanges fell below 10% a year, or 7 days passed.
- Limits: results are medians, and holding windows overlap. Slippage, transfers between exchanges, liquidation and ADL are not included. Fee levels as of 13 November 2026.
Where to start
Open the Binam screener and look at funding on Binance, Bybit and OKX next to the countdown. Before treating a gap as a trade, convert both rates to the same period and set them against 0.20% in fees. To keep risk on any position in proportion to your account, see the one-line position sizing formula.
Trading crypto involves risk. This article is for information only and is not investment advice.