

Order Book Walls Explained: How to Find Them With a Free Crypto Screener and Not Fall for Spoofing
Short answer: an order book wall is a limit order, or a cluster of orders, much larger than the levels around it. Scalpers watch walls near the price because they often act as short-term support or resistance. A wall is a hypothesis, not a fact: it can be pulled in a second. A screener helps you find coins with walls close to the price; the decision to trade is made on the live order book.
Below: what a wall is, how to use a screener in five steps, three ways a wall plays out, how to tell a real wall from spoofing, and what cross-exchange spreads and funding rates actually tell you. Examples use Binam's free screener, which covers Binance, Bybit and OKX and needs no sign-up.
What is an order book wall?
An order book lists every resting limit order: bids to buy below the price and asks to sell above it. A buy wall is an unusually large bid at one level; a sell wall is an unusually large ask. Russian-speaking traders call it a density, «плотность».
"Large" is relative to the coin. A $300,000 bid on BTC is ordinary; on a small altcoin it can equal several minutes of total trading volume. That is why a useful screener measures walls against each market's normal depth instead of using one dollar threshold for everything.
Why walls matter at all: research on order books shows that short-term price moves are driven largely by the imbalance of orders at the best prices, and that the same flow of orders moves price less when the book is deeper (Cont, Kukanov and Stoikov, 2014). A wall adds depth at one level, so price needs more aggressive orders to get through it. That is a statistical effect over seconds and minutes, not a guarantee.
How to use a crypto screener in five steps
A screener replaces scrolling through hundreds of charts. A workable routine:
- Pick the market. Exchange (Binance, Bybit or OKX), futures or spot, and a timeframe for the charts.
- Sort by movement. Five-minute range, NATR (volatility relative to price) or five-minute volume put the coins that are moving right now on top.
- Filter out noise. Set a minimum 24-hour volume so illiquid coins drop out, and keep favourites in a watchlist.
- Check walls near the price. Look at the size in dollars, the distance to the price and how long the wall has been standing.
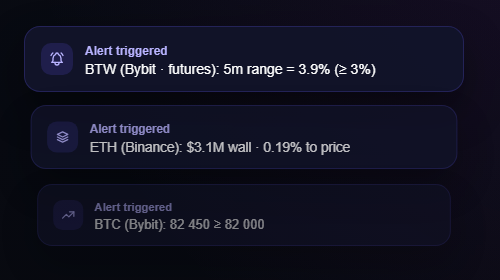
- Set an alert, then decide on the live book. An alert on a price level, a metric or a new wall tells you when to look. The entry decision belongs to the order book and the tape in your terminal.
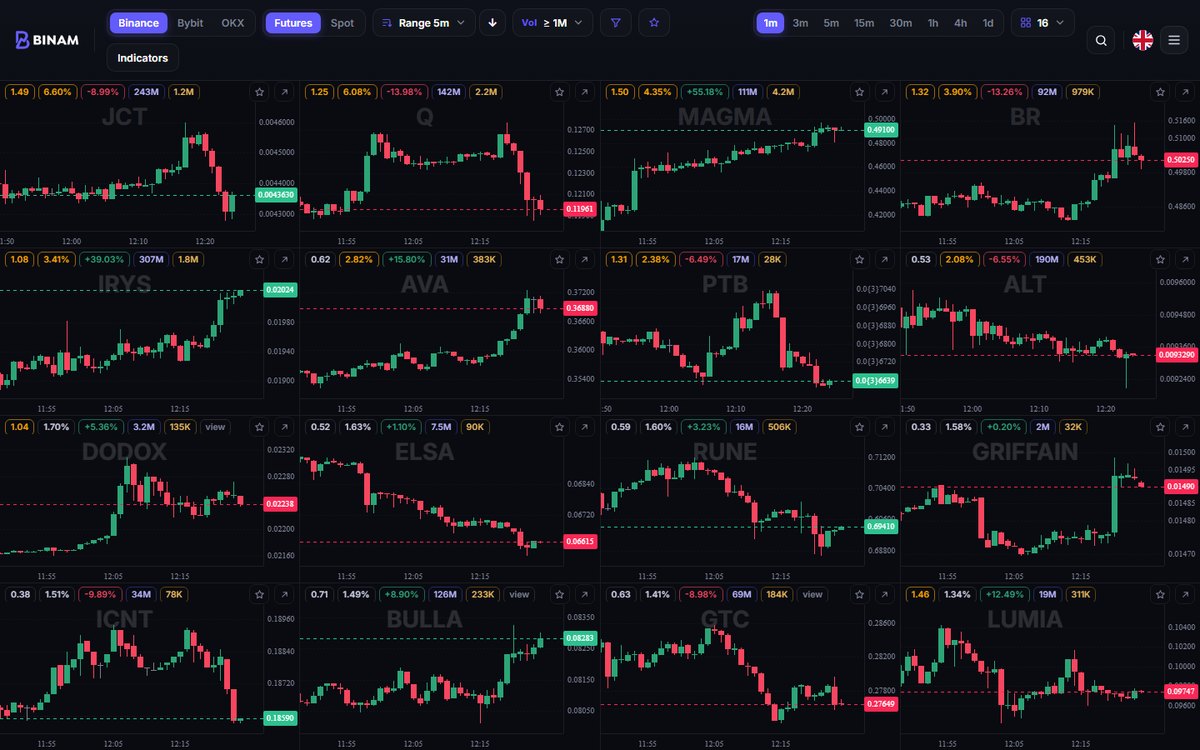
The market map in Binam's screener: 16 of up to 50 live charts, sorted by five-minute range. The numbers above each chart are NATR, five-minute range, 24-hour change, 24-hour volume and five-minute volume.
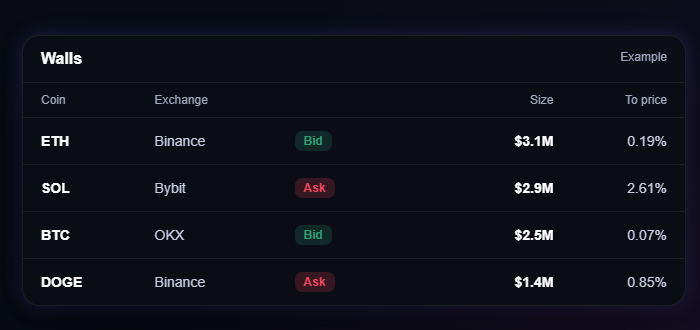
How walls are listed: side (bid or ask), size in dollars and distance to the current price. Example from the screener's page; live values change constantly.
Bounce, eaten, pulled: three ways a wall plays out
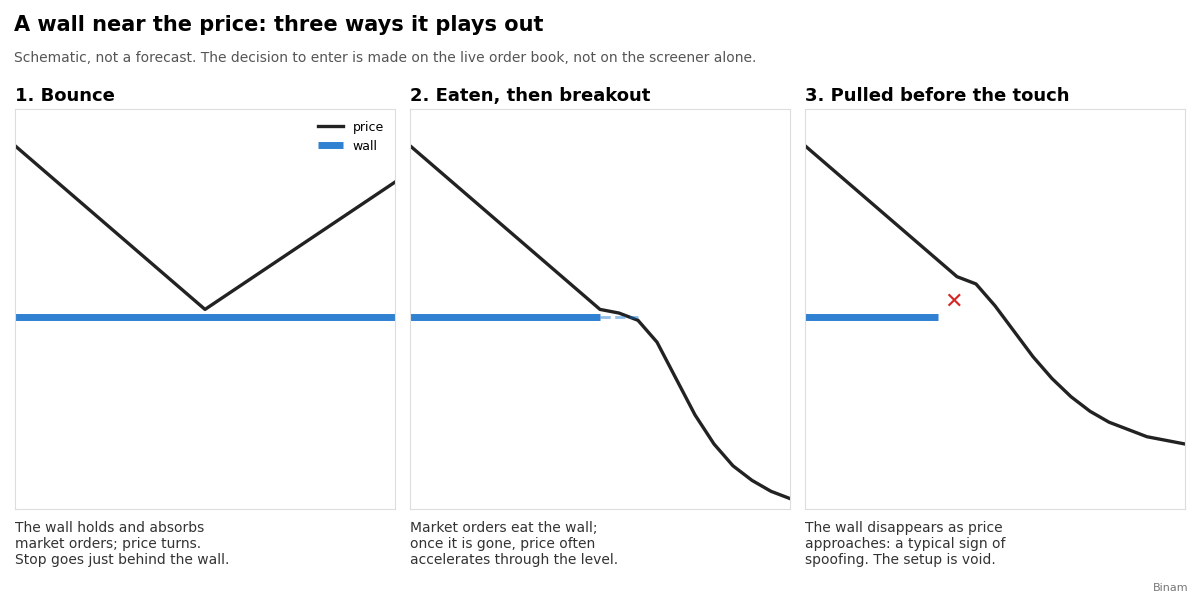
- Bounce. Price reaches the wall, the wall absorbs market orders and price turns. Traders who play this put the stop just behind the wall: if the wall disappears or gets eaten, the idea is wrong.
- Eaten, then breakout. Market orders chip away at the wall («разъедание» in trader slang). Once it is gone, price often accelerates through the level, because traders who leaned on the wall close their positions.
- Pulled before the touch. The wall vanishes as price approaches. That is a typical sign of spoofing, and the setup no longer exists.
These are scenarios, not signals. In each one, what you see on the tape when price arrives matters more than the wall itself: is volume actually trading at that level, or is the order just sitting there?
Real wall or spoofing? A checklist
Nobody can prove intent from an order book; even researchers say so (Cointelegraph Research). You can only weigh the evidence:
| Sign | Points to a real wall | Points to spoofing | What the screener shows |
|---|---|---|---|
| Age | Has stood for tens of minutes or hours, survived several approaches | Appeared a moment ago, moves with the price | How long the wall has been standing |
| Reaction when price arrives | Volume trades at the level, the tape prints | Cancelled or moved one or two ticks before contact | Distance to price; the rest is in the live book |
| Refill | The level absorbs more than was visible and refills (an iceberg order) | — | Not visible in a screener; watch the tape |
| Other exchanges | Similar interest at the same level on two or three exchanges | A huge wall on one exchange, nothing elsewhere | Walls on Binance, Bybit and OKX side by side |
| Chart level | Sits at a day's high or low or a round number | Hangs in empty space | The chart under the wall |
| Size vs volume | Comparable to a few minutes of volume | Many times the coin's whole recent volume | Size in dollars next to five-minute volume |
One research detail worth knowing: a 2025 study of large orders on crypto exchanges found that the distance from the best price is one of the most important features for judging whether an order can move the market (Fabre and Challet, preprint). Close walls matter more than far ones.
Spoofing is market manipulation where markets are regulated. In the US, the Commodity Exchange Act defines it as bidding or offering with the intent to cancel before execution, and the CFTC's guidance gives examples such as creating a false appearance of market depth (CFTC, 2013). In the EU, Article 91 of MiCA bans orders that give false or misleading signals about the supply of or demand for a crypto-asset (ESMA). Offshore exchanges operate in a grey zone, so traders there will see spoofing. Treat every wall as a hypothesis.
Cross-exchange spreads and funding: what they show
A screener that covers several exchanges shows two more things: price gaps between exchanges and funding rates.
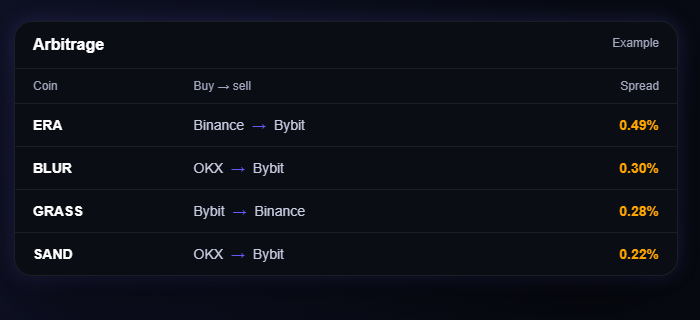
Why spreads exist. Crypto markets are fragmented. A study of 34 exchanges in 19 countries found large, recurring arbitrage gaps, wider between countries than within them, driven by limits on moving capital (Makarov and Schoar, Journal of Financial Economics, 2020).
Why a spread is not free money. A simple calculation with an assumed taker fee of 0.05% per trade:
| Step | Cost |
|---|---|
| Buy on exchange A, sell on exchange B, close both later: four trades × 0.05% | about 0.20% |
| Spread shown in the screener | for example, 0.15% |
| Result before slippage and funding | about −0.05% |
On top of that come slippage (the spread is quoted on last prices, but you trade against the book), different funding on each exchange, transfer time if you move spot coins, margin on both exchanges, and the risk that the spread widens before it closes. Researchers at the BIS describe even standard cash-and-carry trades in crypto as risky because of margin spikes and liquidations (BIS Working Paper 1087). Read a spread as a sign of imbalance or hype that deserves a closer look, not as a ready trade.
Funding rates. On perpetual futures, longs and shorts pay each other a funding fee that keeps the contract close to the spot price. A positive rate means longs pay shorts; a negative rate means shorts pay longs. Binance settles it every 8 hours by default, more often for some contracts, and if you close before the settlement time you neither pay nor receive (Binance FAQ). A strongly positive rate shows crowded leveraged longs; a strongly negative one, crowded shorts. It is context about positioning, not an entry signal. For a scalper, the countdown to the next payment is the practical part: holding through a settlement with a funding rate of 0.1% or more can wipe out the profit of a short scalp.
What a screener cannot do
- Walls get pulled. Any limit order can be cancelled at any moment.
- A screener is slower than the book. Binam's screener scans order books for walls every one to two minutes and re-ranks coins every five seconds; the exchange's book changes in milliseconds. Use the screener to find the coin and the level, then watch the live book.
- Liquidity differs by exchange. The same coin can have a deep book on Binance and a thin one elsewhere, so a $1 million wall means more on the thinner exchange.
- Fees decide whether scalping works. With a typical taker fee of a few hundredths of a percent per side, a round trip costs roughly 0.1%. A scalp has to aim well above that.
Free crypto screeners: what you get without paying
Most order book tools are sold by subscription. As listed on their own pricing pages in October 2026: TradingView's free plan has three price alerts and no order book data; Bookmap's free crypto plan shows one symbol at a time; Coinglass sells large-order data through its API starting from its $299-a-month plan.
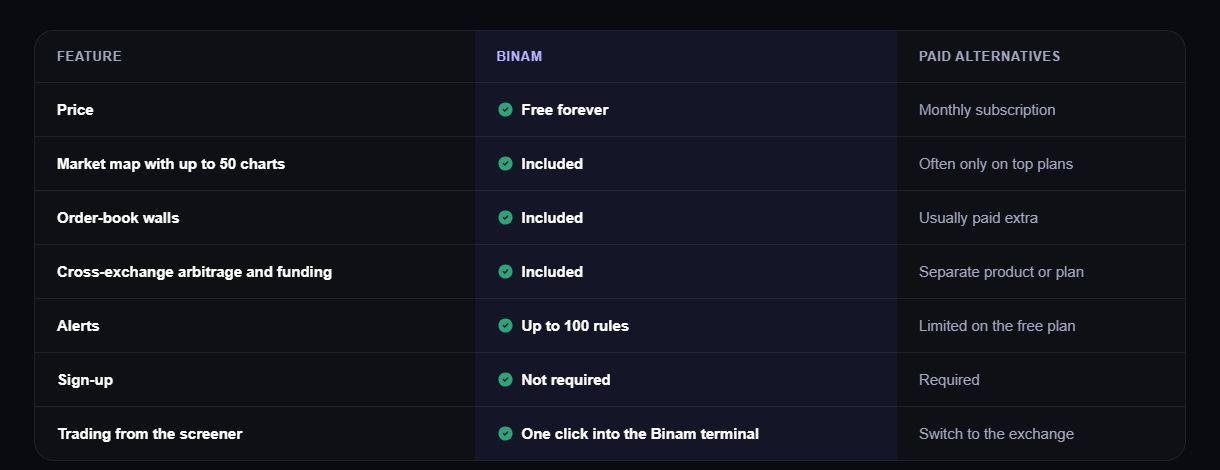
Binam's screener is free with no sign-up: a market map of up to 50 live charts across Binance, Bybit and OKX (more than 3,000 futures and spot markets), walls on futures of all three exchanges with size, distance and age, cross-exchange spreads, funding with a countdown, up to 100 alerts, filters, a watchlist and drawing tools. Clicking a chart opens the Binam trading terminal with that coin.
Frequently asked questions
What is an order book wall in crypto?
It is a limit order, or a group of orders at one price, that is much larger than the surrounding levels of the order book. A buy wall sits below the price, a sell wall above it. Its size only means something relative to the coin's normal volume and depth.
How do you trade off an order book wall?
Traders use three scenarios: a bounce off a wall that holds, a breakout after the wall is eaten by market orders, and standing aside when the wall is pulled before price reaches it. In every case the stop goes just behind the wall, and the decision is made on the live order book.
How can you tell a real wall from spoofing?
Look at how long the wall has stood, whether volume actually trades when price reaches it, whether it refills, whether other exchanges show interest at the same level, and whether it sits at a meaningful chart level. Intent can never be proven from the book alone.
Is spoofing illegal?
In regulated markets, yes: US law and the CFTC treat it as manipulation, and the EU's MiCA regulation bans orders that give false signals about crypto supply or demand. Many offshore exchanges sit outside these rules, so spoofing still appears there.
What is the best free crypto screener for scalping?
Look for live charts across several exchanges, sorting by short-term range or volatility, walls with size, distance and age, alerts and no sign-up. Binam's screener covers those on Binance, Bybit and OKX for free; the screener only finds candidates, and the trading decision is yours.
What does the funding rate tell you?
Who is crowded: a high positive rate means many leveraged longs, a strongly negative one many shorts. It is not an entry signal, but its countdown matters for short trades, because a position held through settlement pays or receives the fee.
Is crypto arbitrage still profitable?
Rarely as simply as a screener suggests. Four trading fees can exceed a typical spread, and slippage, funding, transfer time and margin on two exchanges add cost and risk. Treat a spread as a reason to look closer.
Try it
Open the free screener and start with one routine: sort by five-minute range, check the walls closest to the price, set one alert. When you have a method that holds up, you can trade it on a Binam challenge, keeping each trade within the 3% risk limit. For sizing, see the one-line position sizing formula.
Trading crypto futures involves risk. This article is for information only and is not investment advice.